What is a Main Sequence Star?A main sequence star is a star that is currently going through nuclear fusion, which in short, is the process of fusing hydrogen into helium in the star's core. Main sequence stars all share similar properties in terms of the relationship between their masses and their luminousities, temperatures, and lifetimes. These concepts are all explained below. The vast majority of a star's existence is spent as a main sequence star; the estimation is 90% of stars in the universe are main sequence stars. For instance, a star such as our sun will undergo nuclear fusion for approximately 10 billion years (http://cse.ssl.berkeley.edu/bmendez/ay10/2000/cycle/ms.html; http://hyperphysics.phy-astr.gsu.edu/Hbase/astro/herrus.html#c1). The general composition, by mass, of main sequence stars is 74% hydrogen, 25% helium, and 1% other heavier elements. (http://zebu.uoregon.edu/~js/ast122/lectures/lec14.html). This composition shifts as hydrogen is fused into Helium via nuclear fusion. To fully understand a main sequence star, it is important to understand the process of nuclear fusion. Nuclear FusionNuclear fusion is the process by which "light nuclei combin[e] to form heavier nuclei," which produces energy from combination of elements lighter than iron(http://www.astrophysicsspectator.com/topics/stars/Fusion.html). In main sequence stars the hydrogen is burned in a star's core and converted into helium. In order for nuclear fusion to occur, the core of the star must reach a temperature of approximately 10 million Kelvin. By doing this, the main sequence star is essentially remaining in a state of hydrostatic equilibrium. This occurs because gravity is constantly exerting its force inward towards the core of the star. As gravity pushes the star inward, the core of the star will contract and heat up. Eventually, the core will become hot enough for hydrogen to be burned into helium. When this happens, pressure from within the core exerts force outward, which acts as a balance with the force of gravity pushing inward. As a result, the star is said to be in equilibrium and the nuclear fusion prevents the star from being further collapsed. Refer to the diagram to the right for a visual representation of nuclear fusion. The chemical composition of stars changes as nuclear fusion occurs. For instance, fusion has been ongoing in the core of the Sun for about 5 billion years, and its core is now about 29% hydrogen, 70% helium and 1% everything else. (http://zebu.uoregon.edu/~js/ast122/lectures/lec14.html). This is due to hydrogen continually being fused into helium as the sun has gone through nuclear fusion. | 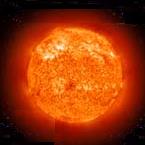 Above is a sample image of a main sequence star. An example of a main sequence star is our sun (Image credited to NASA). Below is a diagram of how nuclear fusion occurs in the core of a main sequence star. It also shows how the pressure from this nuclear fusion is balanced by the gravitational force pushing in. 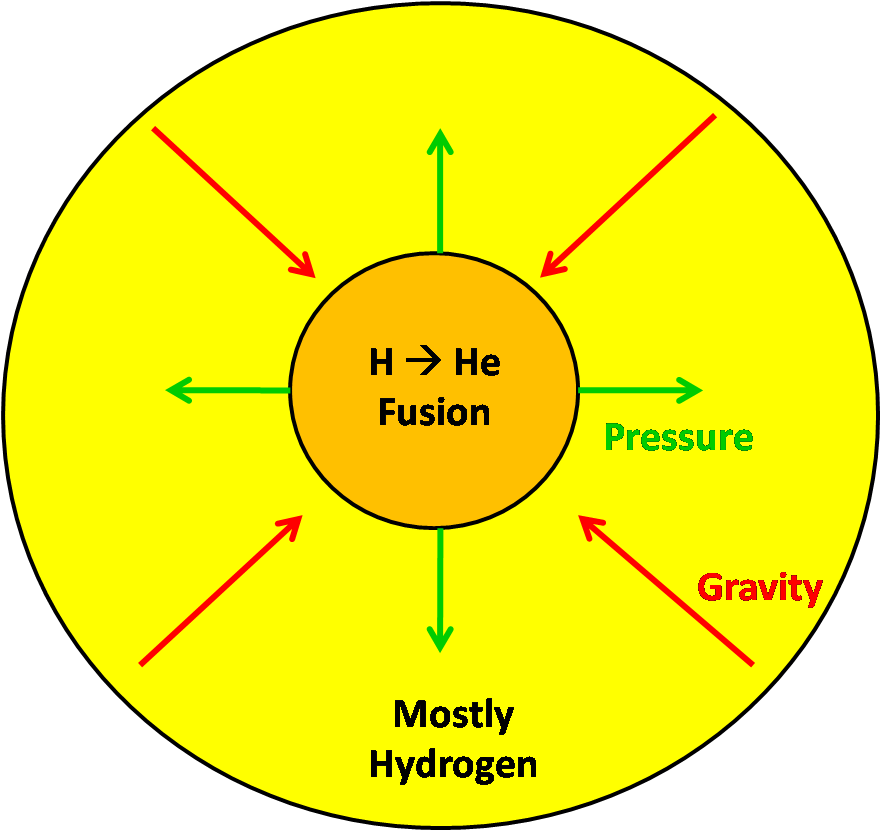 |
Eventually, the hydrogen in the sun, or any star for that matter (although lifespan varies by mass as discussed later on this page), will run out. When this happens, the star will fall out of equilibrium, and the core will begin to contract and heat up due to the force of gravity continuing to exert its force inward. Helium fusion will eventually occur when the core of the star reaches a temperature of at least 100 million degrees Fahrenheit (Australia Telescope Outreach & Education, 2004). This process is more thoroughly examined in the Red Giant section, because when Helium fusion occurs, a star is no longer considered to be a main sequence star.
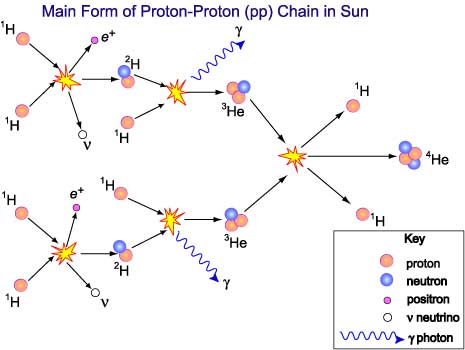
The Proton-Proton ChainThe main process responsible for providing the energy source in main sequence stars is the proton-proton chain, which is the process used by our sun and other stars with less than 1.5 solar masses. This process takes place in stars with cooler temperatures, which is why they have lower masses. The PP Chain, as it is commonly called, accounts for about 85% of the energy released in the sun (Australia Telescope Outreach & Education, 2004). The net equation for this reaction is: 4H-1 à He-4 + 2e+ + 2v + 2Y
In this reaction, 4 hydrogen nuclei protons are fused in the star's core, producing a helium-4 nucleus. The reaction also produced 2 neutrinos, 2 photons, and 2 positrons (Australia Telescope Outreach & Education, 2004). The rate at which this reaction occurs depends on the time it takes for the reaction to first occur. On average, a hydrogen nucleus waits 1 billion years before it interacts with another hydrogen nucleus to begin the sequence. After this though, the reactions take very little time to occur. The diagram below on the left shows the PP Chain in action (http://csep10.phys.utk.edu/astr162/lect/energy/cno.html). The following link will direct you to a Proton-Proton Hydrogen Fusion Simulator that plots several variables that result in the binary fusion processes: http://www.astrophysicsspectator.com/topics/stars/FusionHydrogenPPSim.html Results Page: http://www.astrophysicsspectator.com/topics/stars/FusionHydrogenPPSimResults.html |
 | 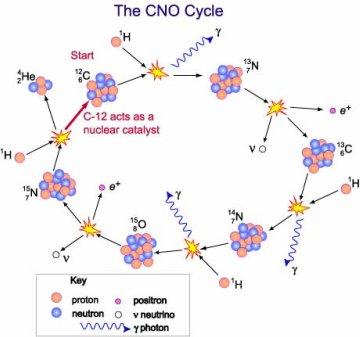 |
The CNO CycleA second process that is used to provide the necessary energy for nuclear fusion in main sequence stars is the CNO cycle. This process is used by more massive stars, or those that have 1.5 solar masses or more. As such, main sequence stars that undergo this equation have warmer temperatures. The CNO stands for carbon, nitrogen, and oxygen, and the reaction is cyclical (as the name suggests). The net equation for this reaction is: 4H-1 → He-4 + 2e+ + 2ν + 3γ In this reaction, a proton fuses with a C-12 nuclei, producing an N-13 nucleus. This N-13 nucleus is unstable, eventually decaying into C-13. This C-13 fuses with another proton, creating N-14, which fuses with another proton, creating O-15. This O-15 is also unstable, so it decays into N-15. When N-15 fuses with a proton, the resultant nucleus splits to form a He-4 nucleus and a C-12 nucleus. This C-12 nucleus is then able to start another cycle of the same sequence of reactions (as C-12 is what began this initial sequence). As you can see, C-12 is not used up in this reaction, but it acts as a catalyst that is essential for the reaction to occur (Australia Telescope Outreach & Education, 2004; http://csep10.phys.utk.edu/astr162/lect/energy/cno.html). This cycle is shown in the diagram above to the right. The reason that the CNO cycle takes place in more massive stars is because the reaction requires greater temperatures to start. Due to the kinetic molecular theory, which basically states that the warmer the temperature, the faster gas particles move, the temperature in a star's core must be hot enough to allow the proton to fuse with the C-12 nuclei. As such, core temperatures in these higher-mass stars are 18 million Kelvin or greater (Australia Telescope Outreach & Education, 2004). On the other hand, the PP chain involves the fusing of Hydrogen protons, so temperatures do not need to be as high because the repulsion forces are not as strong. The following link will direct you to a CNO Hydrogen Fusion Simulator that plots several variables that result in the binary fusion processes: http://www.astrophysicsspectator.com/topics/stars/FusionHydrogenCNOSim.html Results Page: http://www.astrophysicsspectator.com/topics/stars/FusionHydrogenCNOSimResults.html Also, check out the graph below for more information on the temperature differences in main sequence stars and how temperature affects the process used to provide energy for nuclear fusion. |
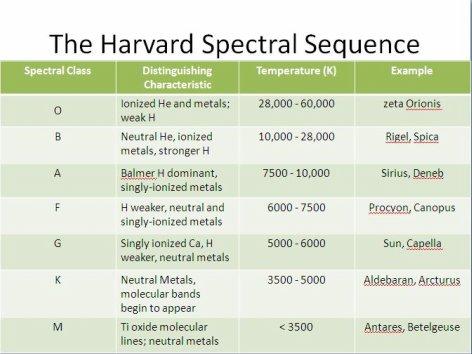
OBAFGKM
These seven letters represent the seven major spectral types of that we use to classify stars. Astronomers were able to observe the spectral sequences of various stars during the late 19th century by putting a glass prism in front of a telescope’s objective lens and then photographing a patch of sky containing a large number of stars. At first, scientists were unsure what to do with all of this data, so they began classifying stars based on the presence of hydrogen lines in their spectra. The stars with the strongest hydrogen lines were designated Type A stars, slightly weaker hydrogen lines were designated Type B stars, and so on down the alphabet (Life in the Universe, 2007).
Annie Jump Cannon, a Harvard student, was hired to continue this research, and she was able to conclude that there are seven major spectral types based on redundancies she noticed in the spectral lines. These seven types are OBAFGKM, with each letter being subdivided even further. There are distinct properties that apply to these seven types of stars, and thus there are patterns that scientists noticed in these stars. Type O stars are the most massive, have the greatest luminosities (which is the total amount of light the star emits into space), have the hottest surface temperatures, and have the shortest lifetimes. This pattern follows along the line so that Type M stars are the least massive, have the lowest luminosities, have the coolest surface temperatures, and have the longest lifetimes (Life in the Universe, 2007). These properties were identified from the results of the Hertzsprung-Russell Diagram, which is shown further below. Also, please observe the table below that shows the characteristics of the seven spectral types of stars.
 |
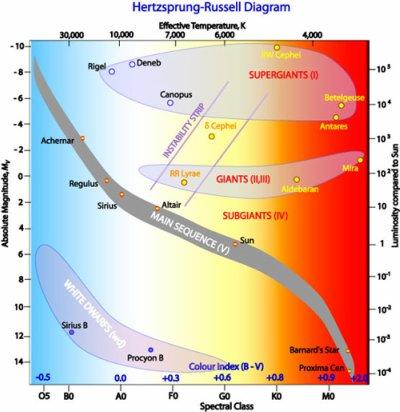
Hertzsprung-Russell Diagram
This diagram was formed by Danish astronomer Ejnar Hertzsprung, who had collected data on the distances of nearby stars. He noticed that if he arranged the stars by color, from blue-white to red, there was a clear relationship between the star’s luminosity. He noticed that the hottest stars, which were the most blue, were more luminous than the cooler stars, which were the red stars. Then, Hertzsprung realized when he classified the cooler red stars according to their distances, the more distant red stars were much more luminous than the nearer ones (Life in the Universe, 2007). In addition, the American astronomer Henry Norris Russell plotted the spectral class of the stars vs. the stars' absolute magnitude (their absolute luminosity). He found that the relationship between the temperature and the luminosity of the star fell into specific groups (Australia Telescope Outreach & Education, 2004).
In looking at the diagram, it is clear that most of the stars travel in a diagonal pattern from the top left to the bottom right. These stars are called main sequence stars. The stars that are part of this main sequence are those that are burning hydrogen in their cores, or those that are currently going through nuclear fusion. Refer above for an explanation on nuclear fusion. This diagram shows the properties that explain the seven types of stellar spectra examined previously. Type O stars are located on the top left of the diagram, while Type M stars are located on the bottom right. To help you understand this further, the sun is a Type G star and is located towards the middle of the diagonal line running across the diagram. The vast majority of stars in our universe are main sequence stars: 9 out of 10 to put it in perspective. This means that stars spend 90% of their lives going through nuclear fusion (http://hyperphysics.phy-astr.gsu.edu/Hbase/astro/herrus.html#c1).
Another important fact derived from this diagram is that a main sequence star’s mass is the most important factor in determining where it lies on the diagram. As we move from the bottom right to the top left in the diagram, the main sequence stars become more massive. In fact, a main sequence star's mass determines both the star's luminosity and its average lifespan. There is a direct relationship between the star's mass and its luminosity, as the more massive the star, the greater its luminosity. On the contrary, there is an inverse relationship between the star's mass and its lifespan, as more massive star's will leave the main sequence stage more quickly than lower-mass stars. This is because more massive stars burn their hydrogen more quickly. The reason for this is that the gravitational force exerted on more massive stars is greater, which heats the core of the star to greater temperatures, thereby causing the nuclear fusion reaction to occur at a faster rate (Australia Telescope Outreach & Education, 2004). All of these relationships with the masses of main sequence stars are more easily seen in the table below.
| Mass/MSun | Luminosity/LSun |
Effective Temperature(K) |
Radius/RSun | Main sequence lifespan (yrs) |
|---|---|---|---|---|
| 0.10 | 3×10⁻³ | 2,900 | 0.16 | 2×10¹² |
| 0.50 | 0.03 | 3,800 | 0.6 | 2×10¹¹ |
| 0.75 | 0.3 | 5,000 | 0.8 | 3×10¹⁰ |
| 1.0 | 1 | 6,000 | 1.0 | 1×10¹⁰ |
| 1.5 | 5 | 7,000 | 1.4 | 2×10⁹ |
| 3 | 60 | 11,000 | 2.5 | 2×10⁸ |
| 5 | 600 | 17,000 | 3.8 | 7×10⁷ |
| 10 | 10,000 | 22,000 | 5.6 | 2×10⁷ |
| 15 | 17,000 | 28,000 | 6.8 | 1×10⁷ |
| 25 | 80,000 | 35,000 | 8.7 | 7×10⁶ |
| 60 | 790,000 | 44,500 | 15 | 3.4×10⁶ |